February 3, 2026Risk
Seeing Clearly Online: How New Digital Signals Help Models Manage Risk More Effectively

Managing approval rates in online lending requires a constant balance – between making credit accessible and preserving portfolio quality amid limited and volatile information. Application forms, certificates, and self-reported income are often unavailable or difficult to scale. Even when present, they tend to correlate poorly with a user’s real-time financial behavior across a large share of applications. For some segments – especially those without stable income – this limitation is structural rather than temporary. For scoring models, the result is higher uncertainty and reduced predictive power.
The constraints of traditional data are now widely recognized not only by market participants, but also by researchers. In a recent TED talk, “Can AI Uplift Entrepreneurs That Traditional Banks Reject?”, entrepreneur and researcher Mercedes Bidart demonstrates how AI and alternative signals can be used to assess creditworthiness where classic models fail to “see” the customer at all – such as micro-entrepreneurs and users without a formal credit history. In these cases, an automated decline often does not reflect true risk. A borrower may have stable income and predictable financial behavior, but not in the form of standard questionnaires and official documents.
This perspective closely aligns with what we have observed in our own research and product practice for more than a decade. Over this period, we have developed and patented multiple approaches to analyzing digital and behavioral signals that compensate for gaps in traditional data. As financial products increasingly move online, seamlessly collected markers – related to devices, infrastructure, and behavior – are becoming essential for maintaining the balance between approval rates and portfolio quality, without increasing friction or requesting sensitive information from customers.
At the same time, income remains a critical factor in credit decisioning. This creates a paradox: users are uncomfortable discussing finances, and in online channels, direct income questions significantly reduce conversion. Some applicants skip these questions entirely, while others provide formal or unreliable answers. According to our research, this share can reach up to 15%. As a result, the market faces a familiar challenge: it becomes easier to filter out potentially good customers at the entry point than to correctly identify and approve them.
The behavioral layer plays a distinct role in risk assessment. The variable IDX2 User Behaviour Markers is built on factors related to different categories of a virtual user’s online behavior or device usage. On one side, it includes frequency-based characteristics, such as the historical number of applications or financial product requests originating from a single device or virtual user, with or without specific time periodicity. On the other, it incorporates parameters that capture the stability – or, conversely, the variability – of the data used in credit applications or product requests.
A high diversity of data points associated with a single device or virtual user typically indicates elevated operational risk. In addition, the variable accounts for various online behavior characteristics observed during the application session itself.
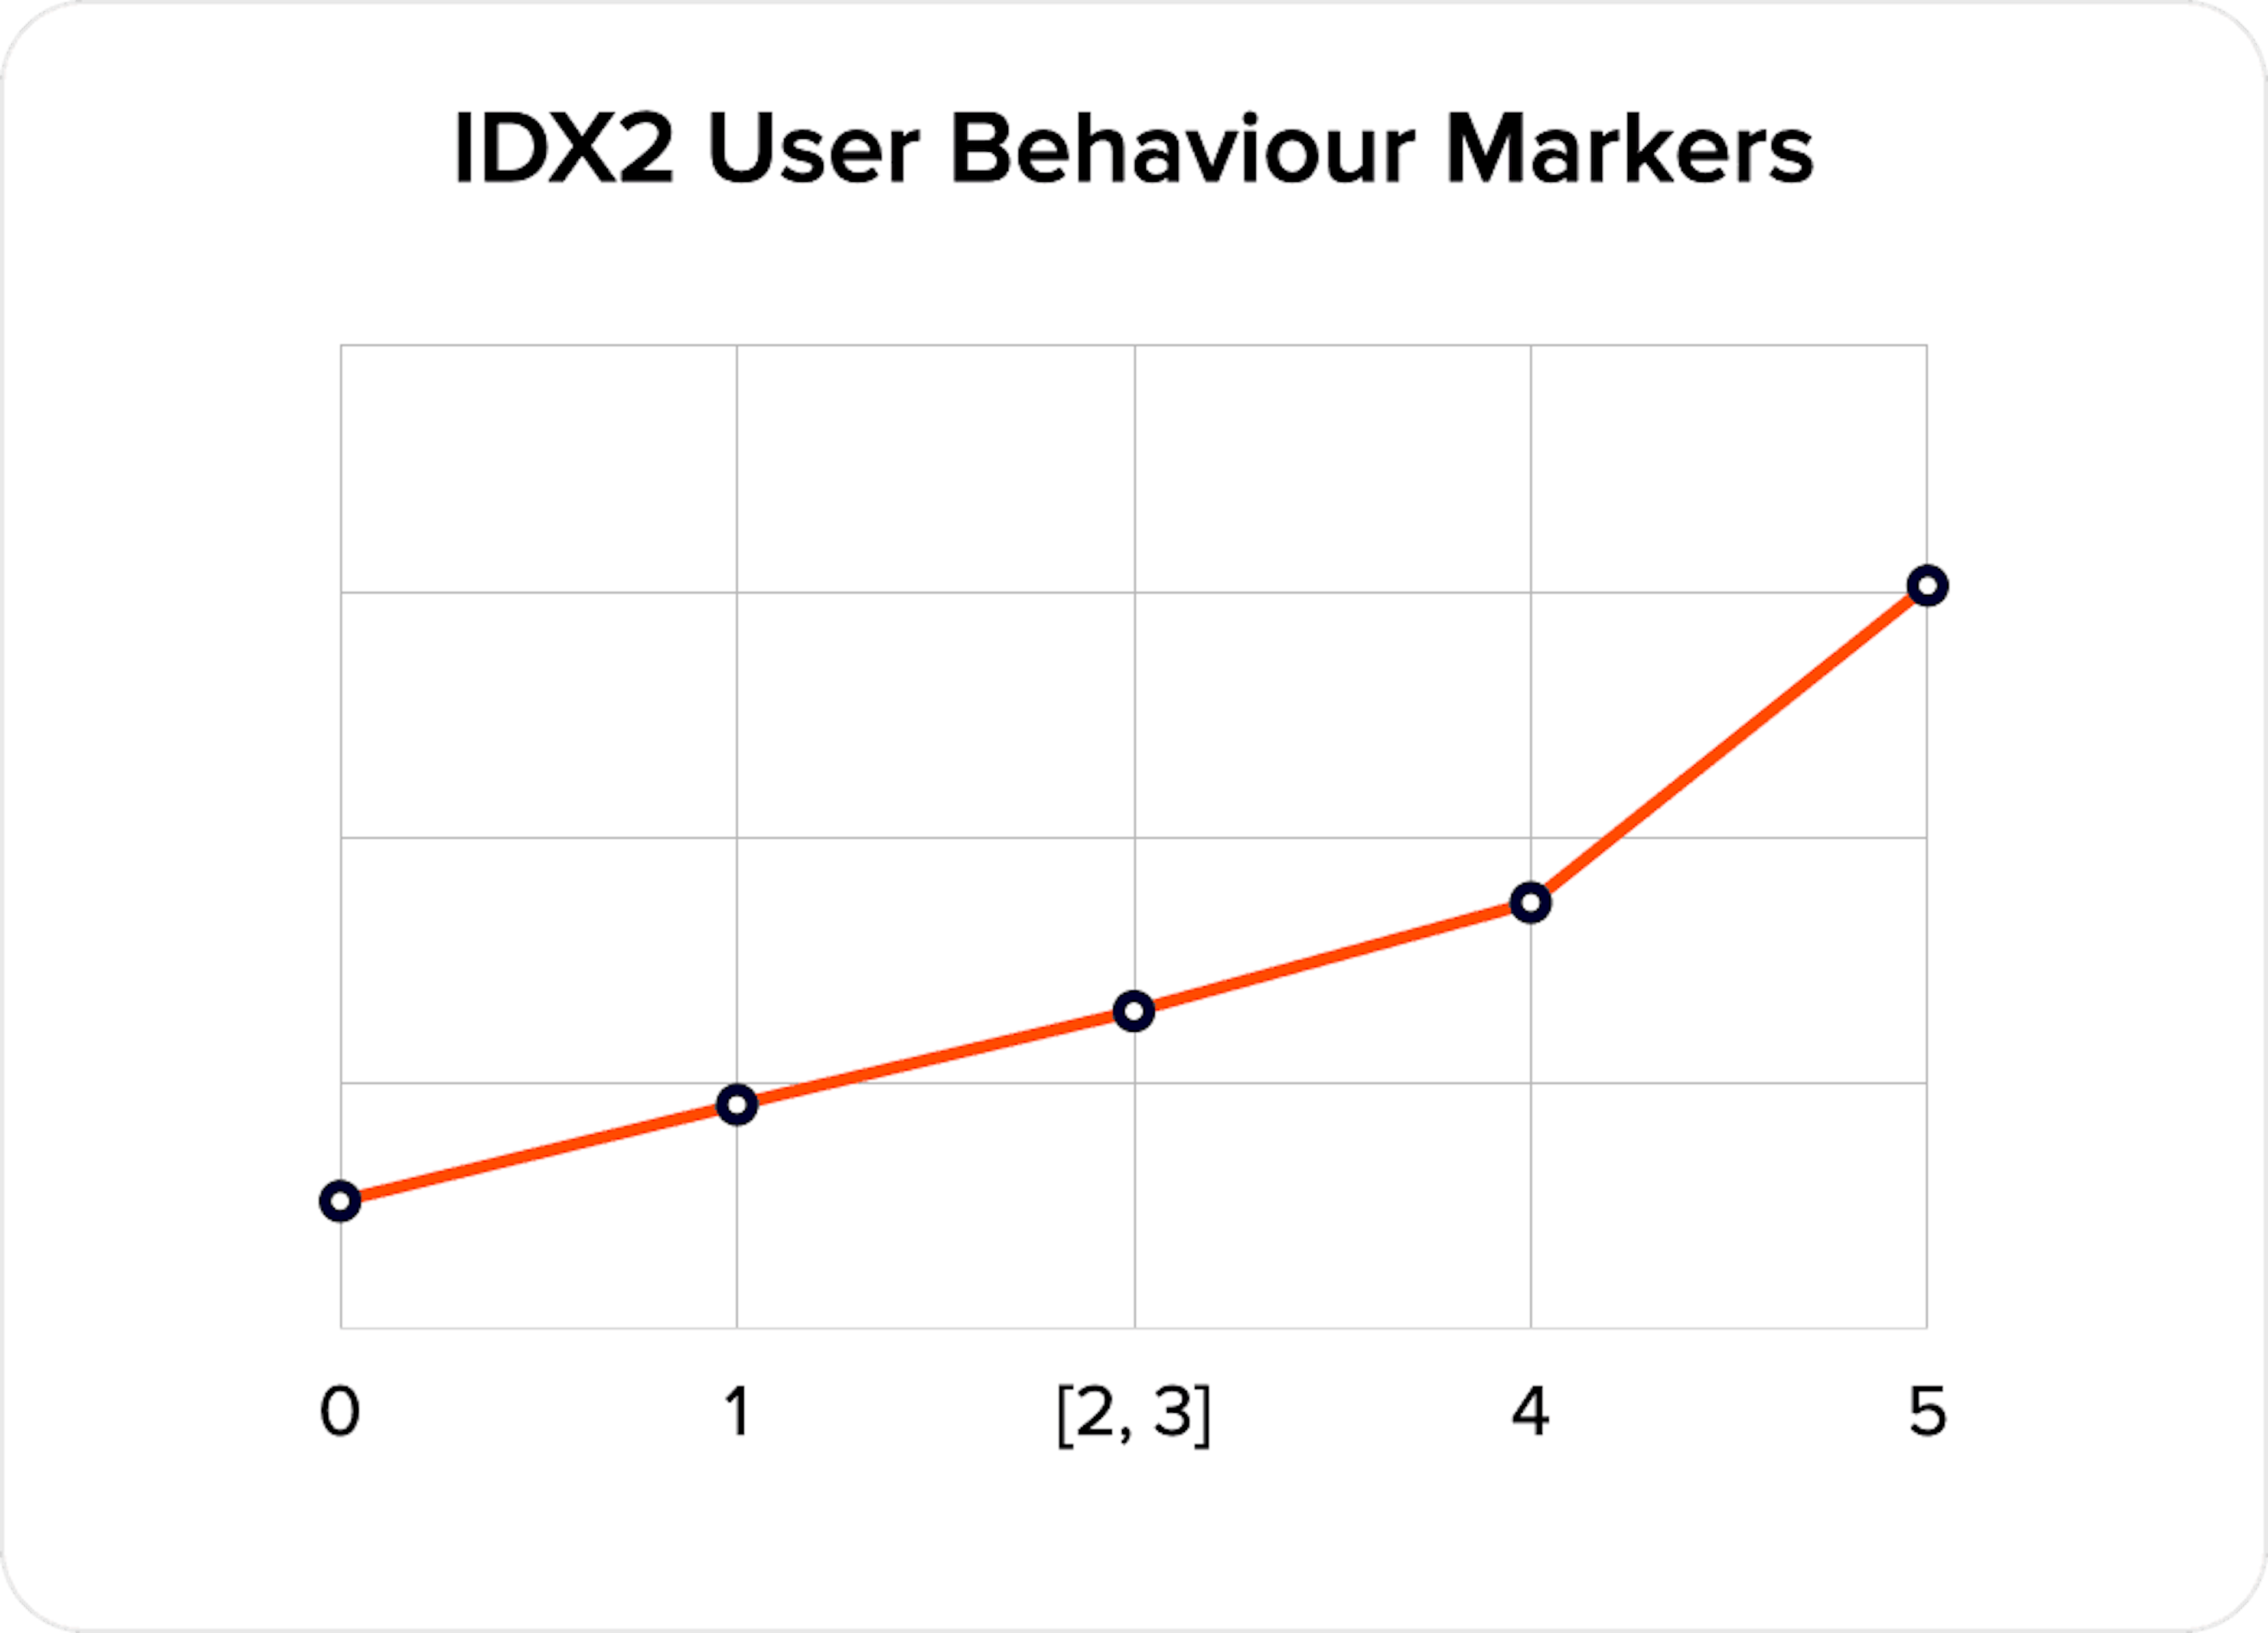
A high frequency of requests without direct data manipulation is often associated with increased credit risk – commonly referred to as credit shopping, when a borrower applies for multiple loans across different lenders within a short time window. When high request frequency coincides with high variability of application data on the same device or virtual user, it becomes a strong indicator of elevated operational risk.
This marker captures interaction dynamics and evaluates behavior throughout the session. It is a clear example of a signal that cannot be derived from borrower documents. Yet it is precisely these behavioral signals that help models perform better in borderline cases – when traditional features appear neutral and the decision remains uncertain.
For scoring to be resilient and scalable, individual signals need to be consolidated into clear, aggregated indices – especially when those indices already carry a meaningful composite interpretation.
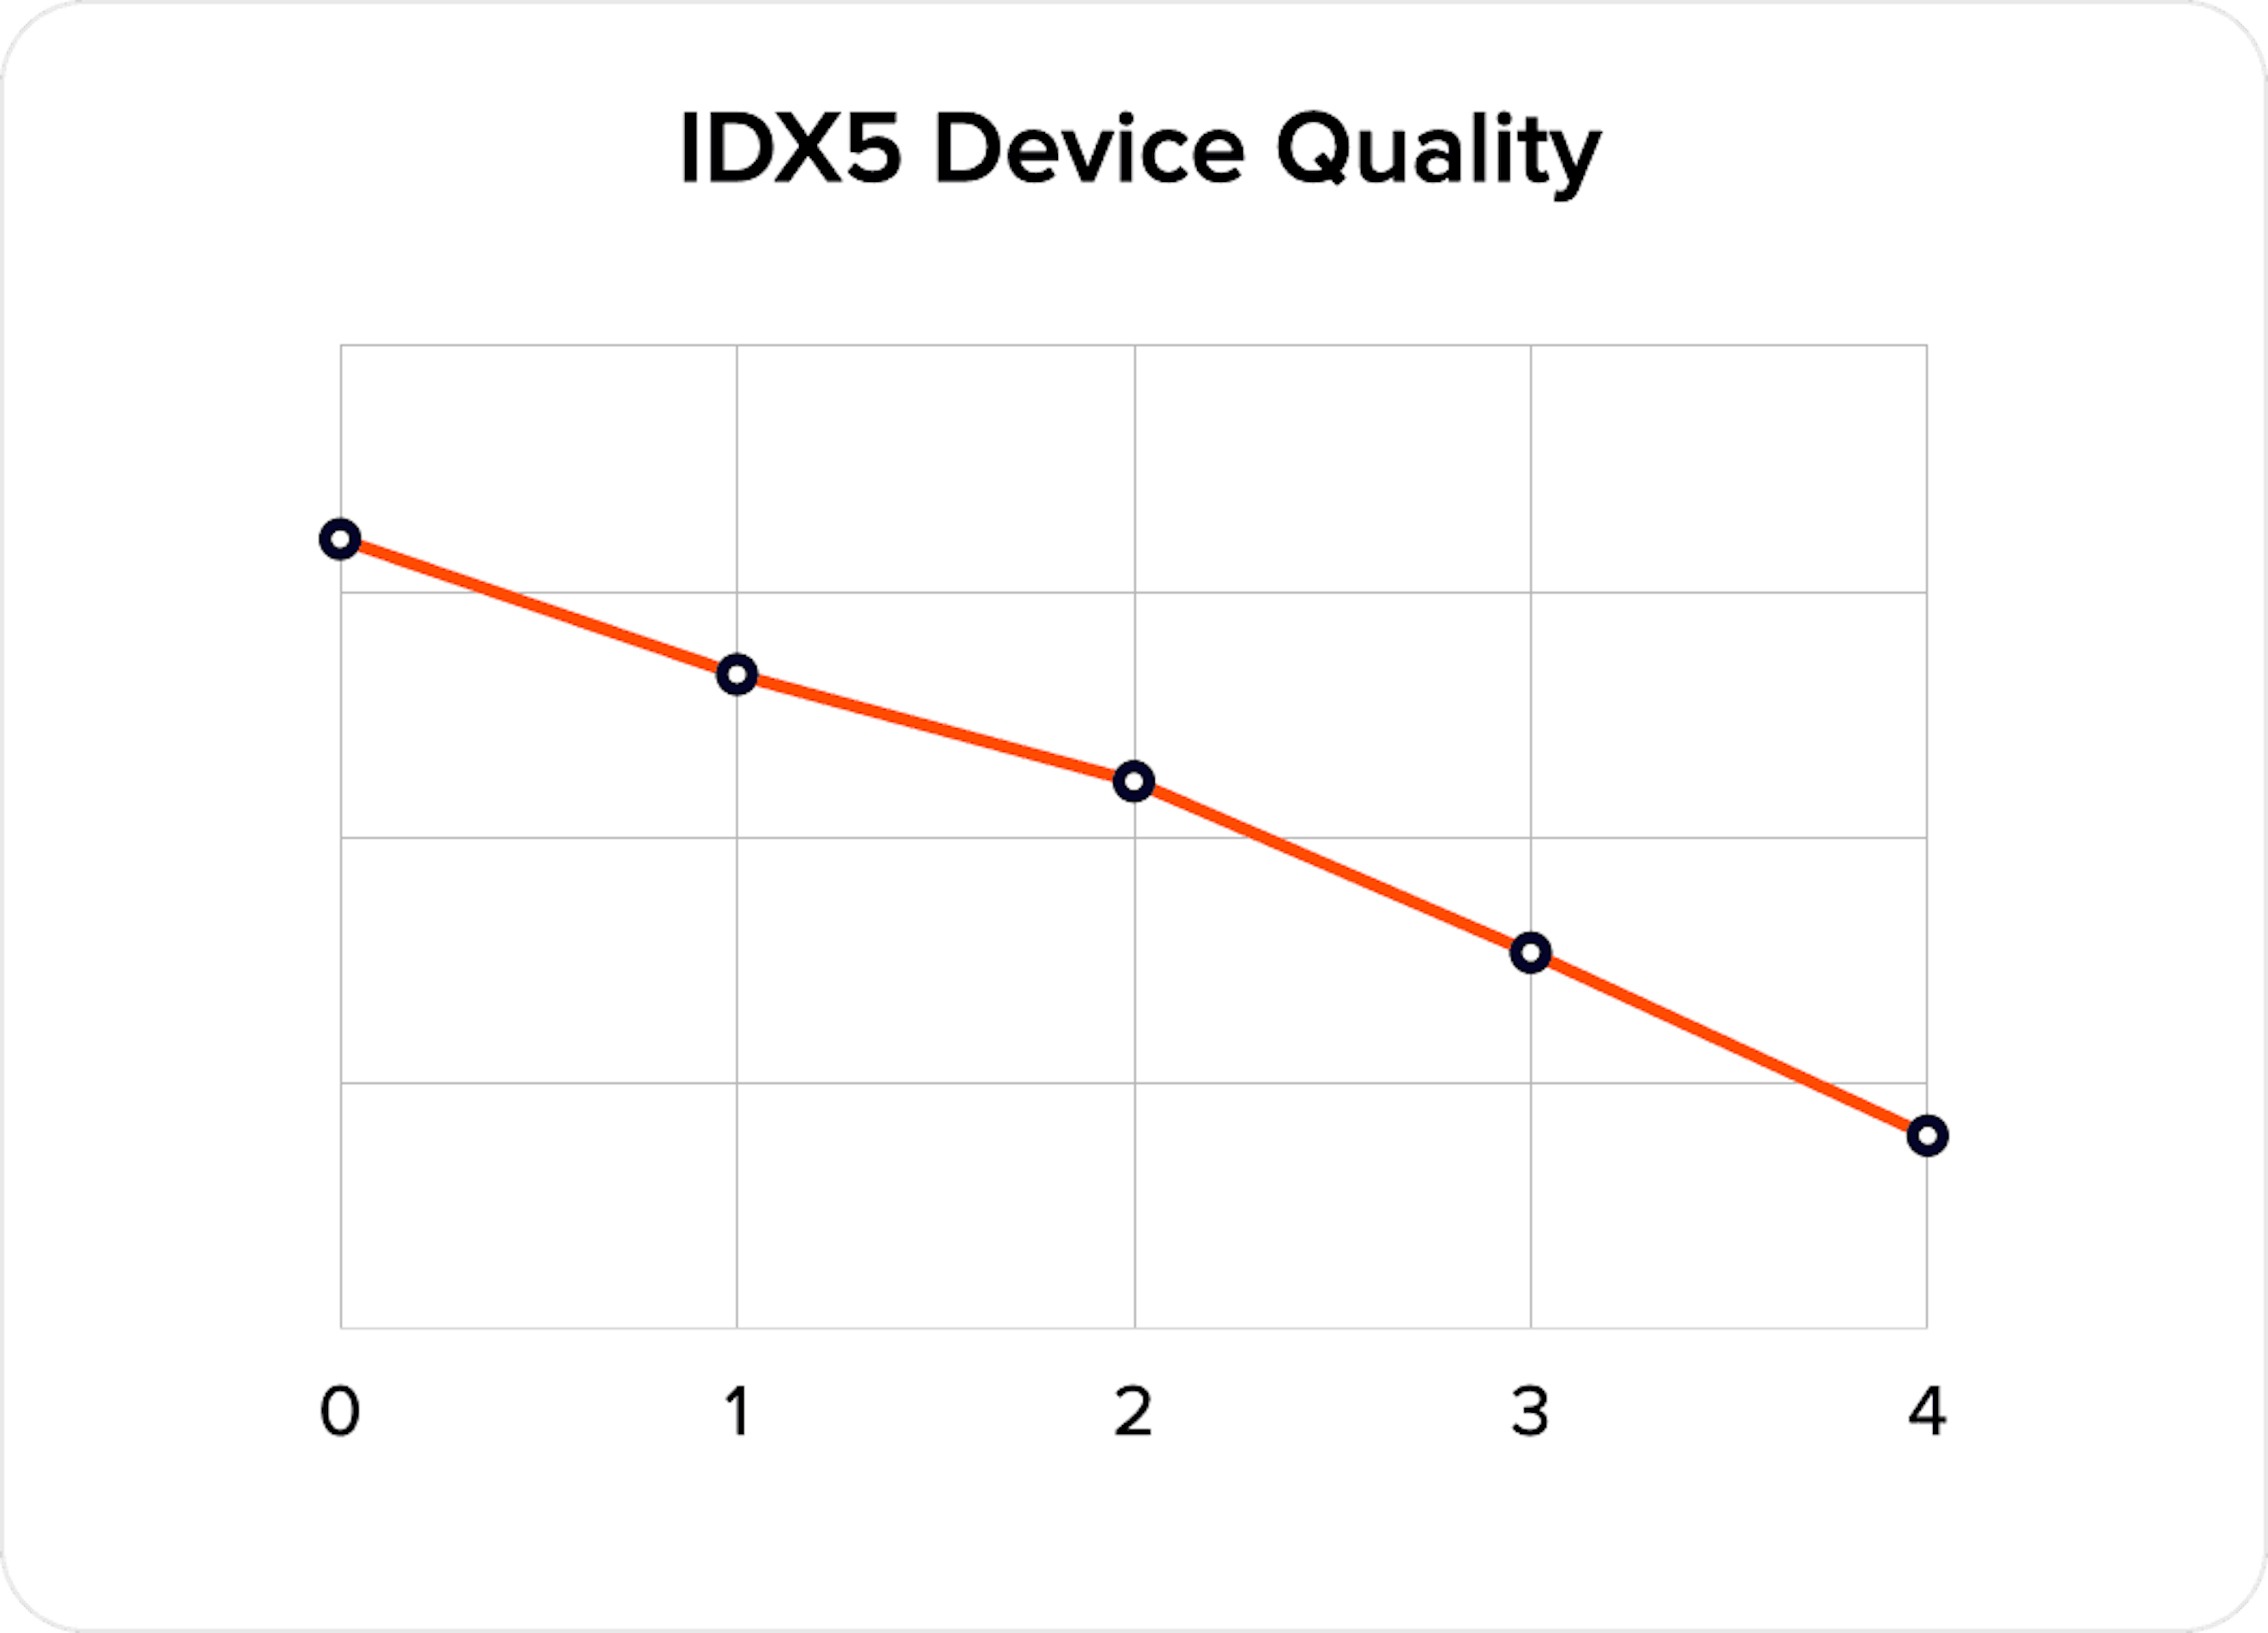
In operational risk assessment, the primary objective is to decline applicants with a high likelihood of default or non-payment. Credit risk assessment, by contrast, focuses on identifying segments that can be offered a financial product under appropriate terms. The aggregated variable IDX5 belongs to the second category and enables segmentation of incoming traffic by credit risk level. This capability becomes particularly valuable in markets where traditional credit history data is limited, incomplete, or of uneven quality.
IDX5 Device Quality is a numerical index representing a combination of a device’s technical characteristics and is treated as a positive factor. In practice, it often emerges as one of the strongest predictors in a model, allowing for a fast assessment of the user’s digital environment and its alignment with a given risk segment.
IDX6 Internet Infrastructure Quality is another positive factor – a numerical index reflecting the quality of the applicant’s regional internet infrastructure. Its value lies in providing contextual information that is difficult to manipulate within a single application. Infrastructure quality and regional environment are systematically linked to income distribution and economic stability.
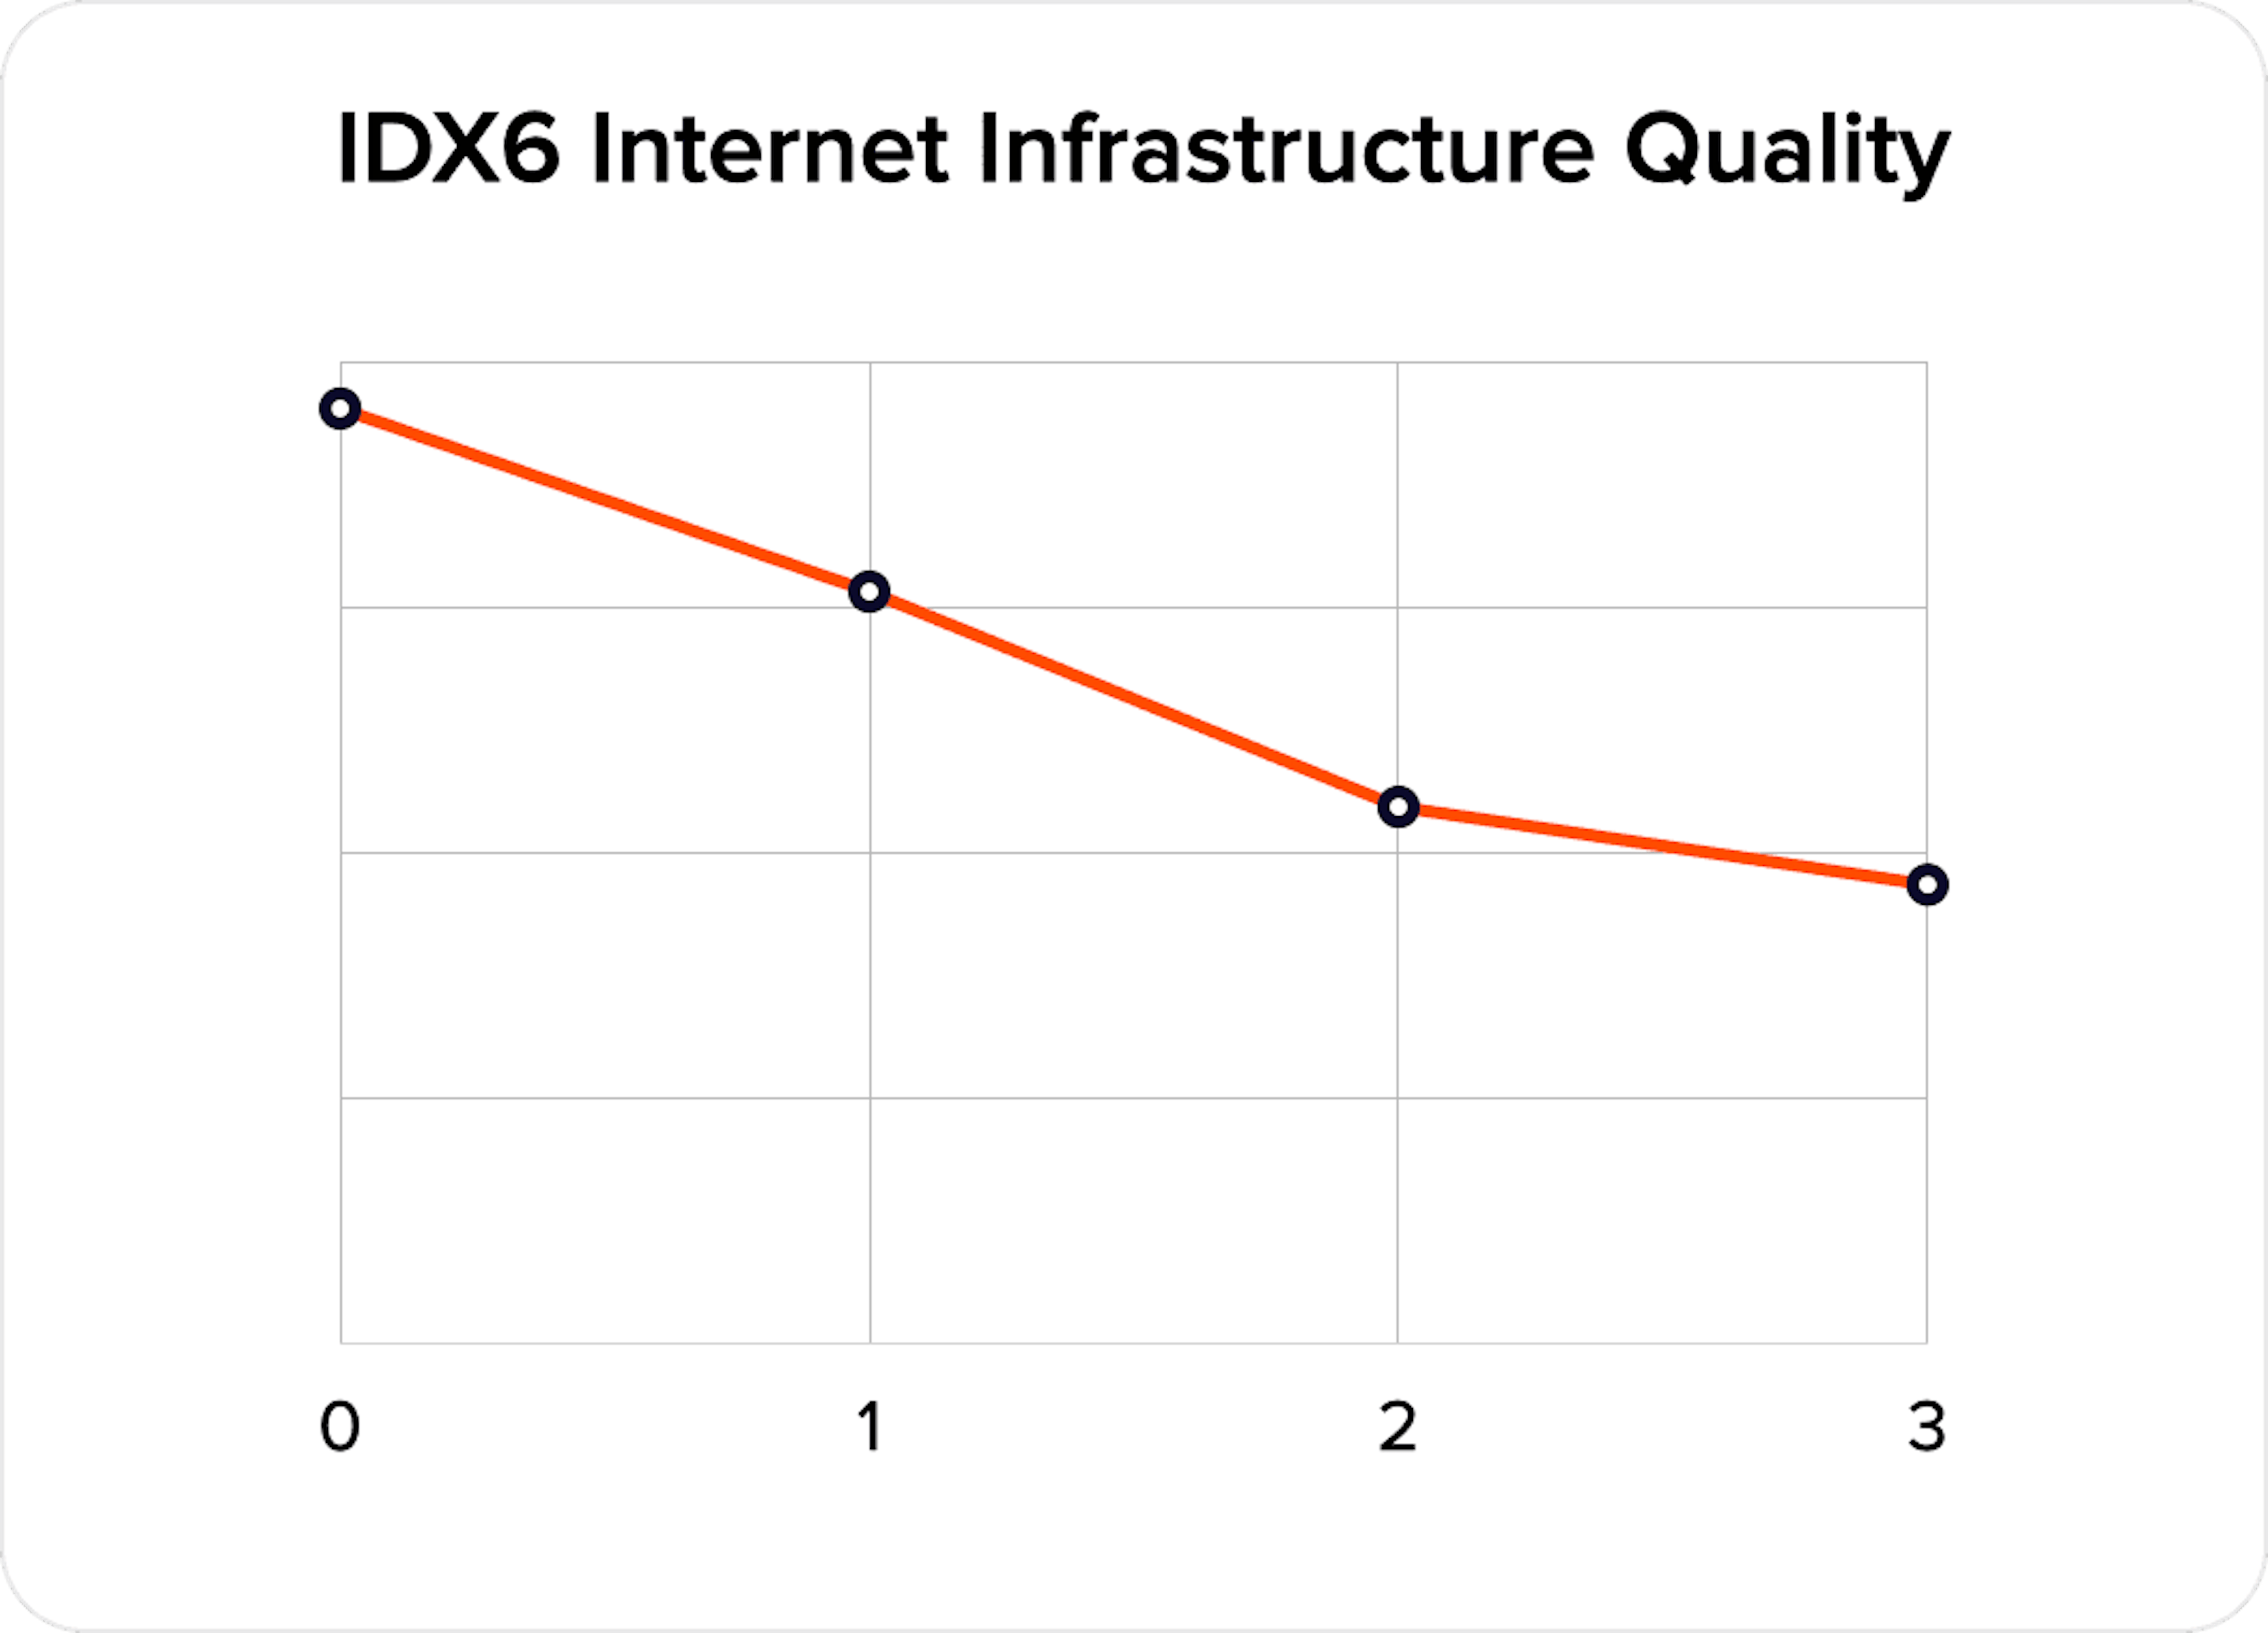
This index is recommended for credit risk assessment and for identifying socially driven default risk. It can be used as a parameter in credit scoring models. Values equal to or above 2 typically indicate a more premium sub-segment within the application flow. The index includes indicators such as IP region, regional risk level, and connection speed and stability for the relevant subnet.
In mobile scenarios, IDX7 Device Applications Quality adds an important additional layer of insight. This positive factor, applicable to mobile SDKs, represents an aggregated assessment of the applications installed on the applicant’s device. It is recommended for identifying credit risk and socially driven default risk. To evaluate this parameter, collection of the final application list must be enabled as part of the SDK integration.
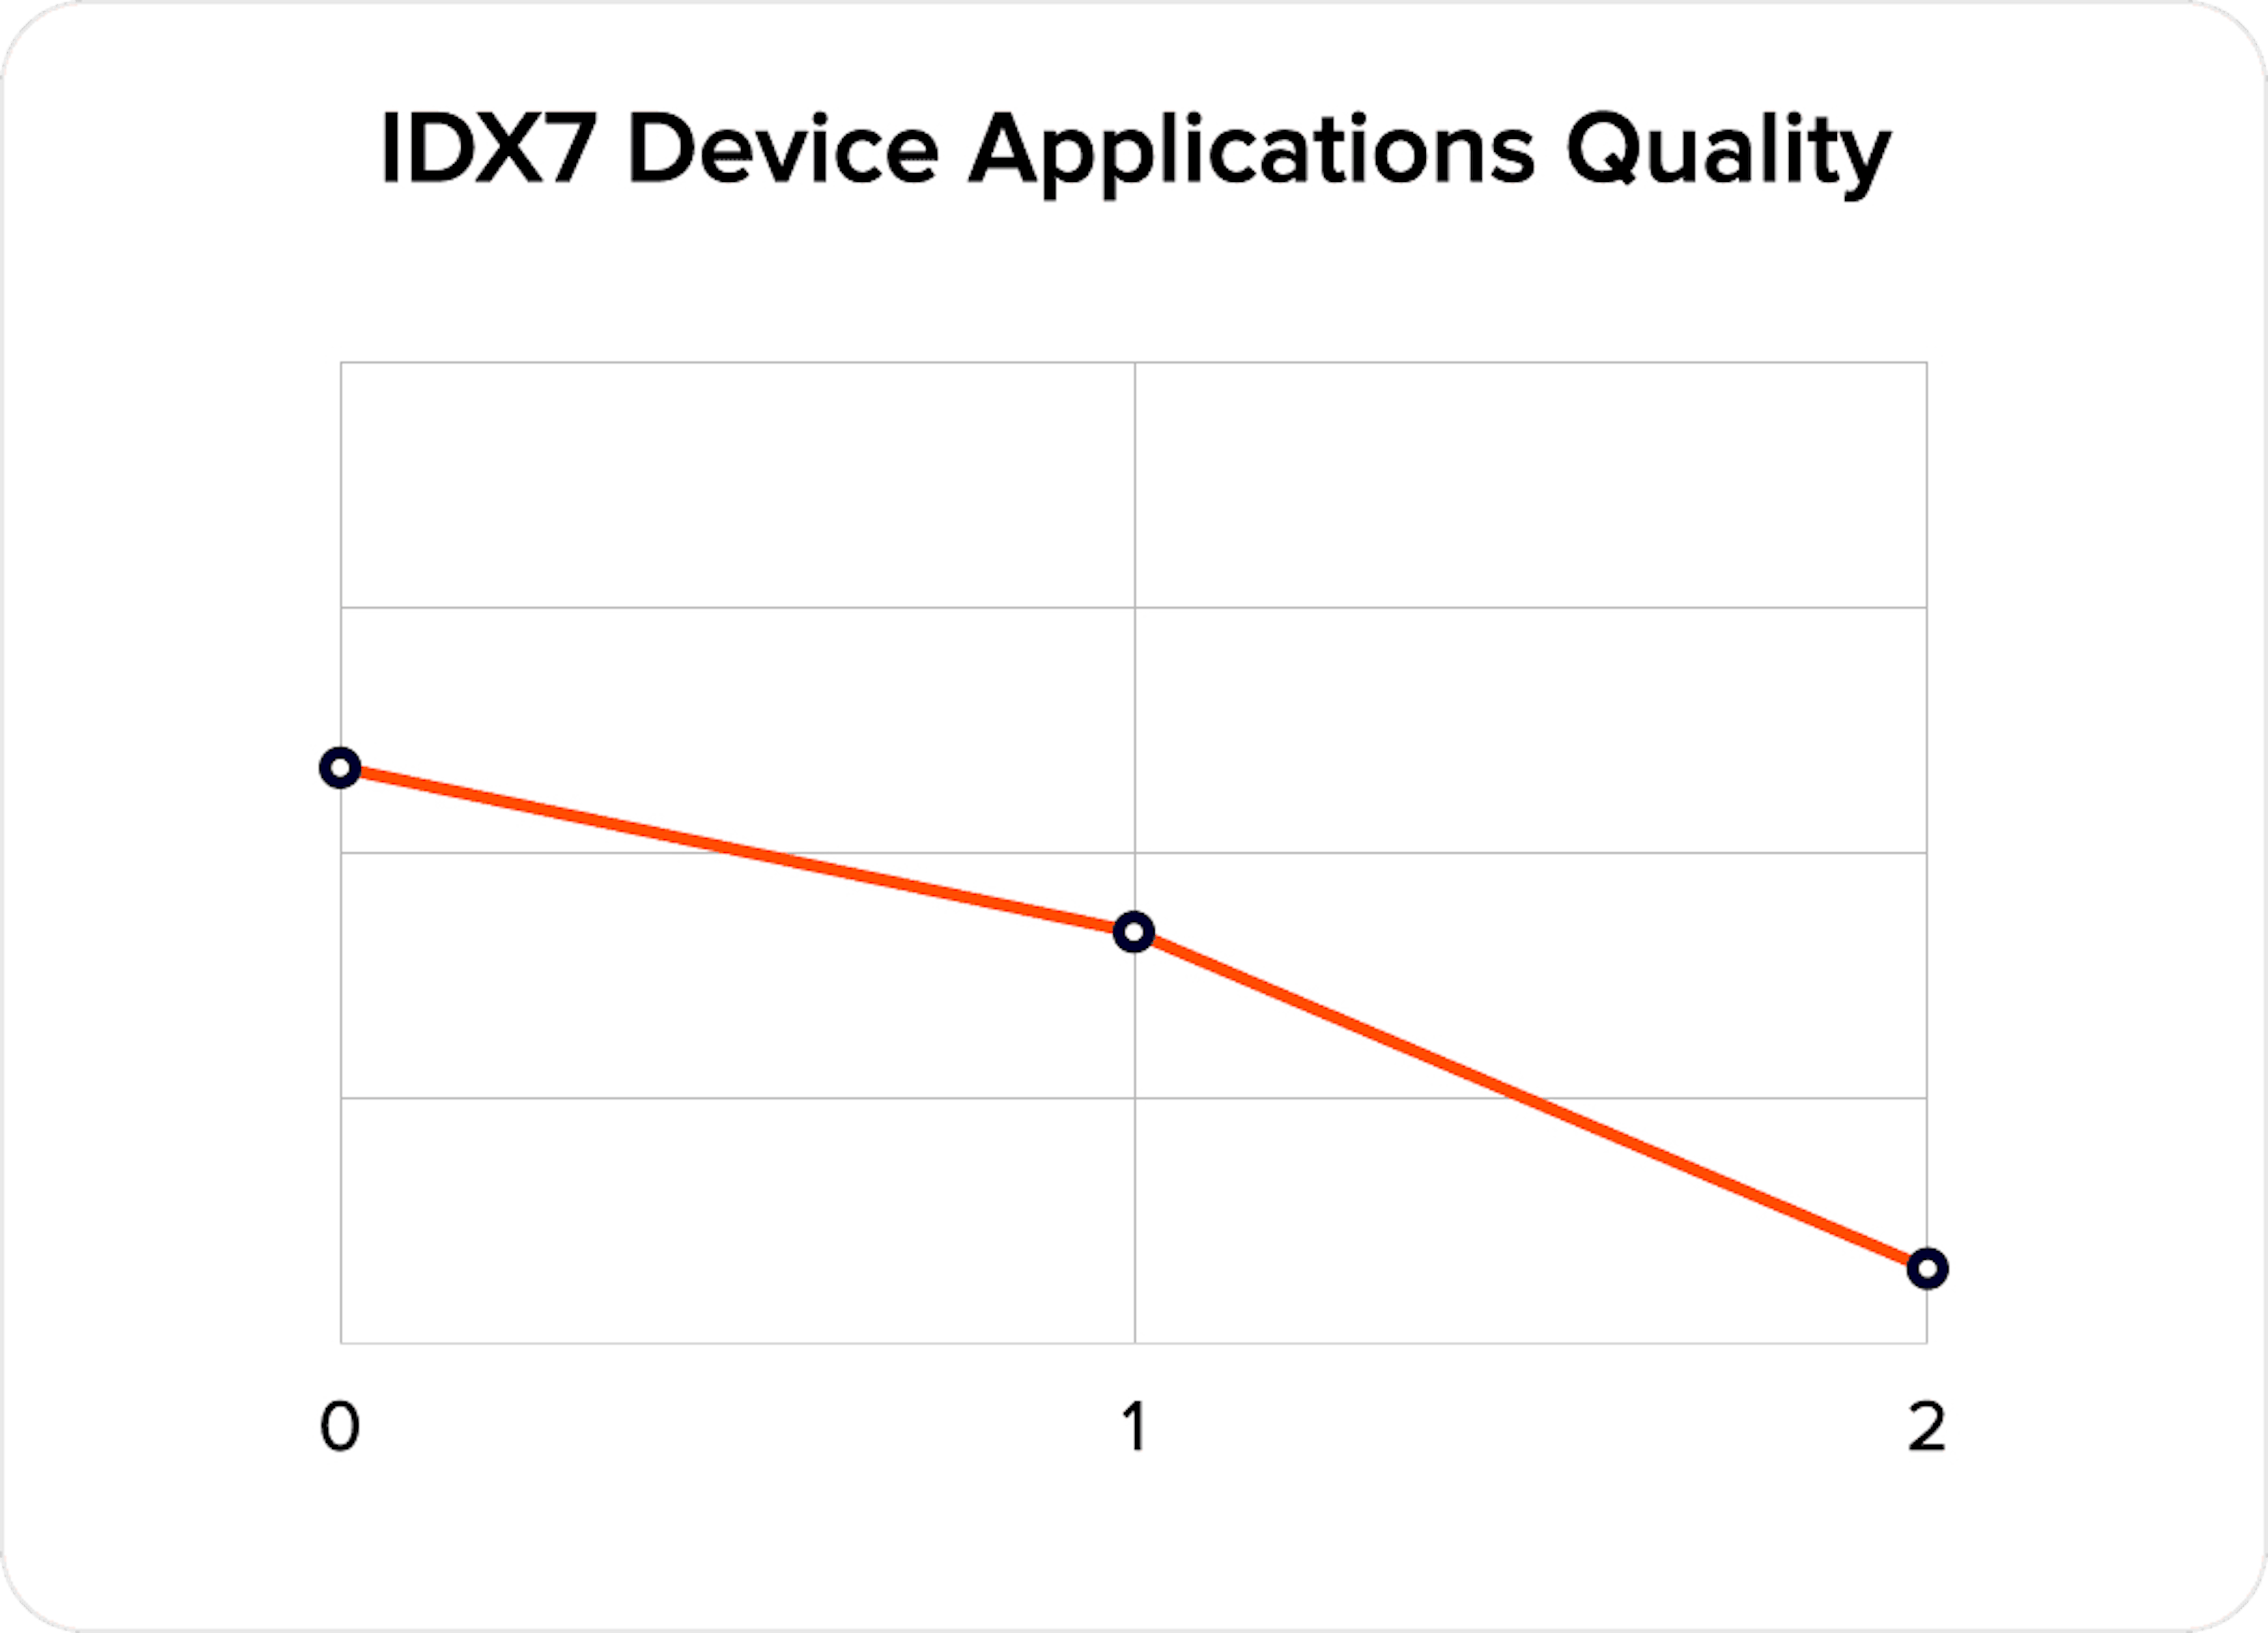
This signal allows for a more accurate understanding of the user’s digital environment. Application structure, category, and overall “quality” enhance model performance and help interpret risk more precisely in cases where web-based signals may be limited.
In practice, the strongest results are achieved by combining the behavioral index IDX2 with aggregated environment quality indices – IDX5 Device Quality, IDX6 Internet Infrastructure Quality, and IDX7 Device Applications Quality.
IDX2 introduces real-time behavioral dynamics and improves differentiation between credit and operational risk. IDX5–IDX7, in turn, establish a stable background of the user’s digital environment, including device quality, regional infrastructure constraints, and mobile context. Together, these indices reinforce one another and provide a more holistic view of the applicant, especially in edge cases where traditional features do not support a confident decision.
One illustrative parameter is JS Downlink, a numerical measure of download speed during a session (in Mbps). Low download speed often serves as a risk marker, as it may indicate an unstable user environment or infrastructure limitations that are statistically associated with applicant quality.
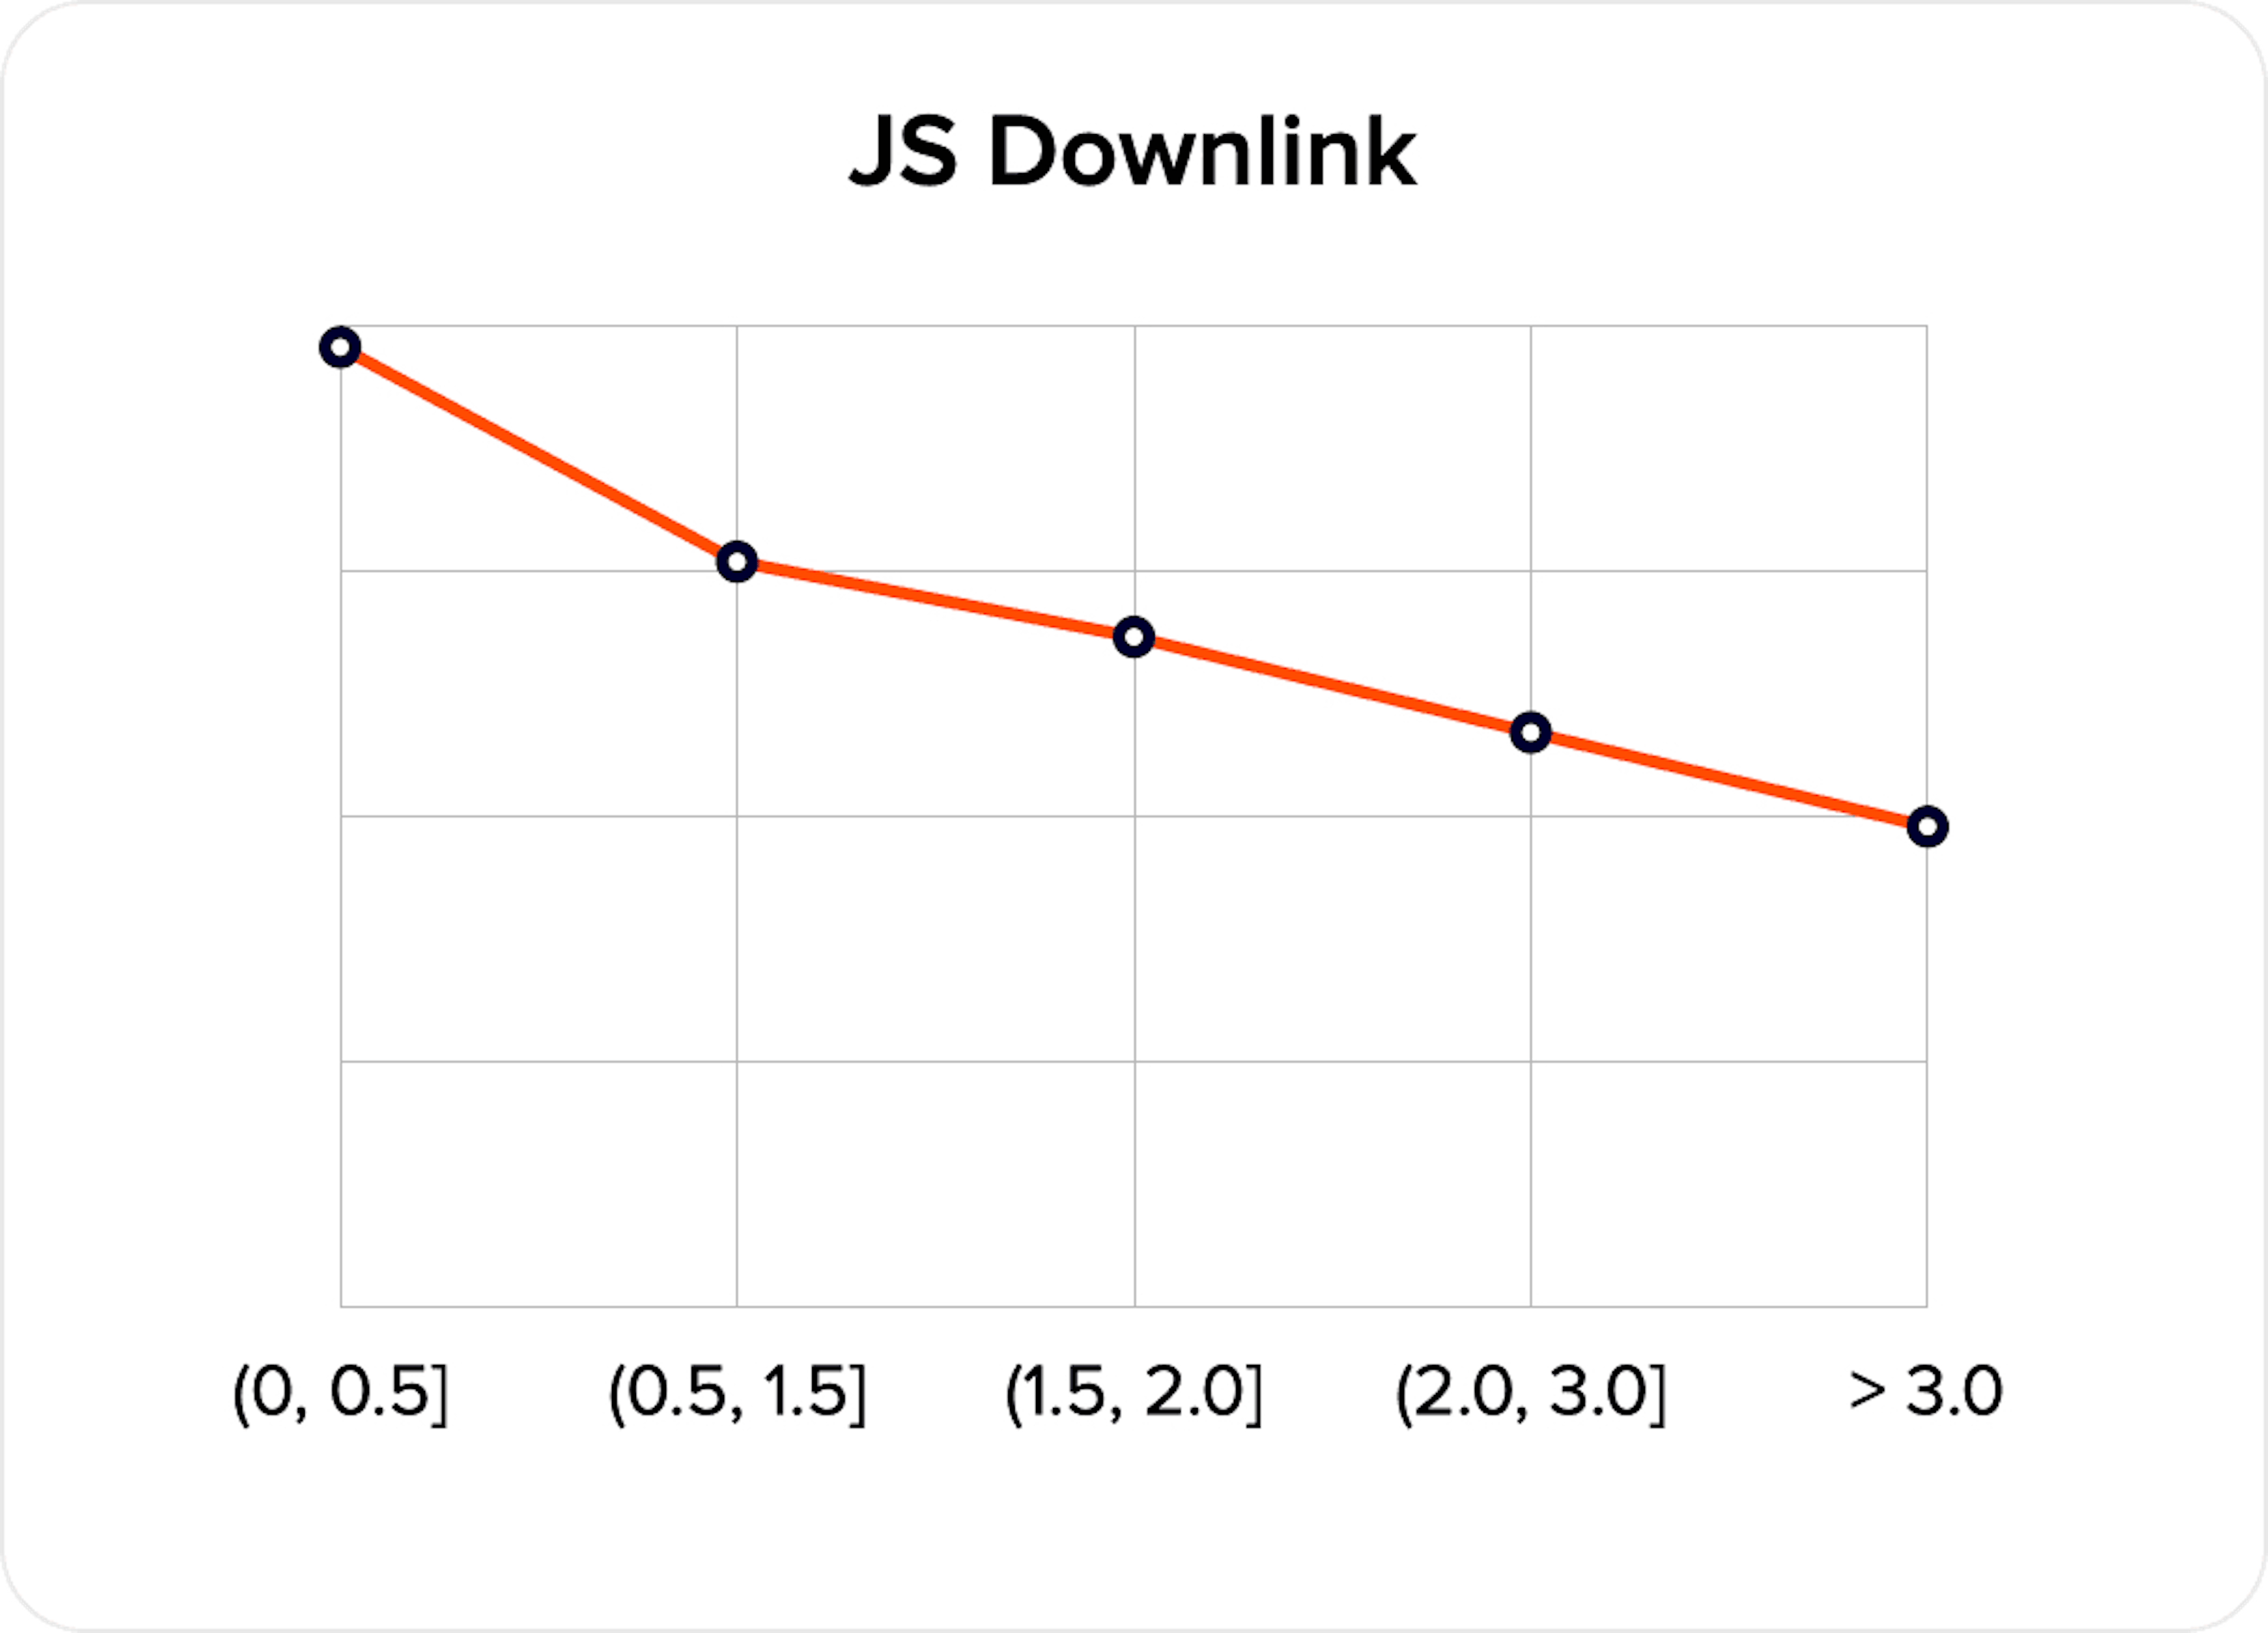
This parameter is especially valuable because it is collected seamlessly and requires no additional action from the customer. The signal appears during interaction and can be immediately incorporated into the scoring model.
Device characteristics can also signal technical manipulation. Performance metrics are particularly useful for refining scoring models. Two numerical parameters stand out: RAM productivity and Storage productivity, which reflect the performance of a device’s memory and storage components.
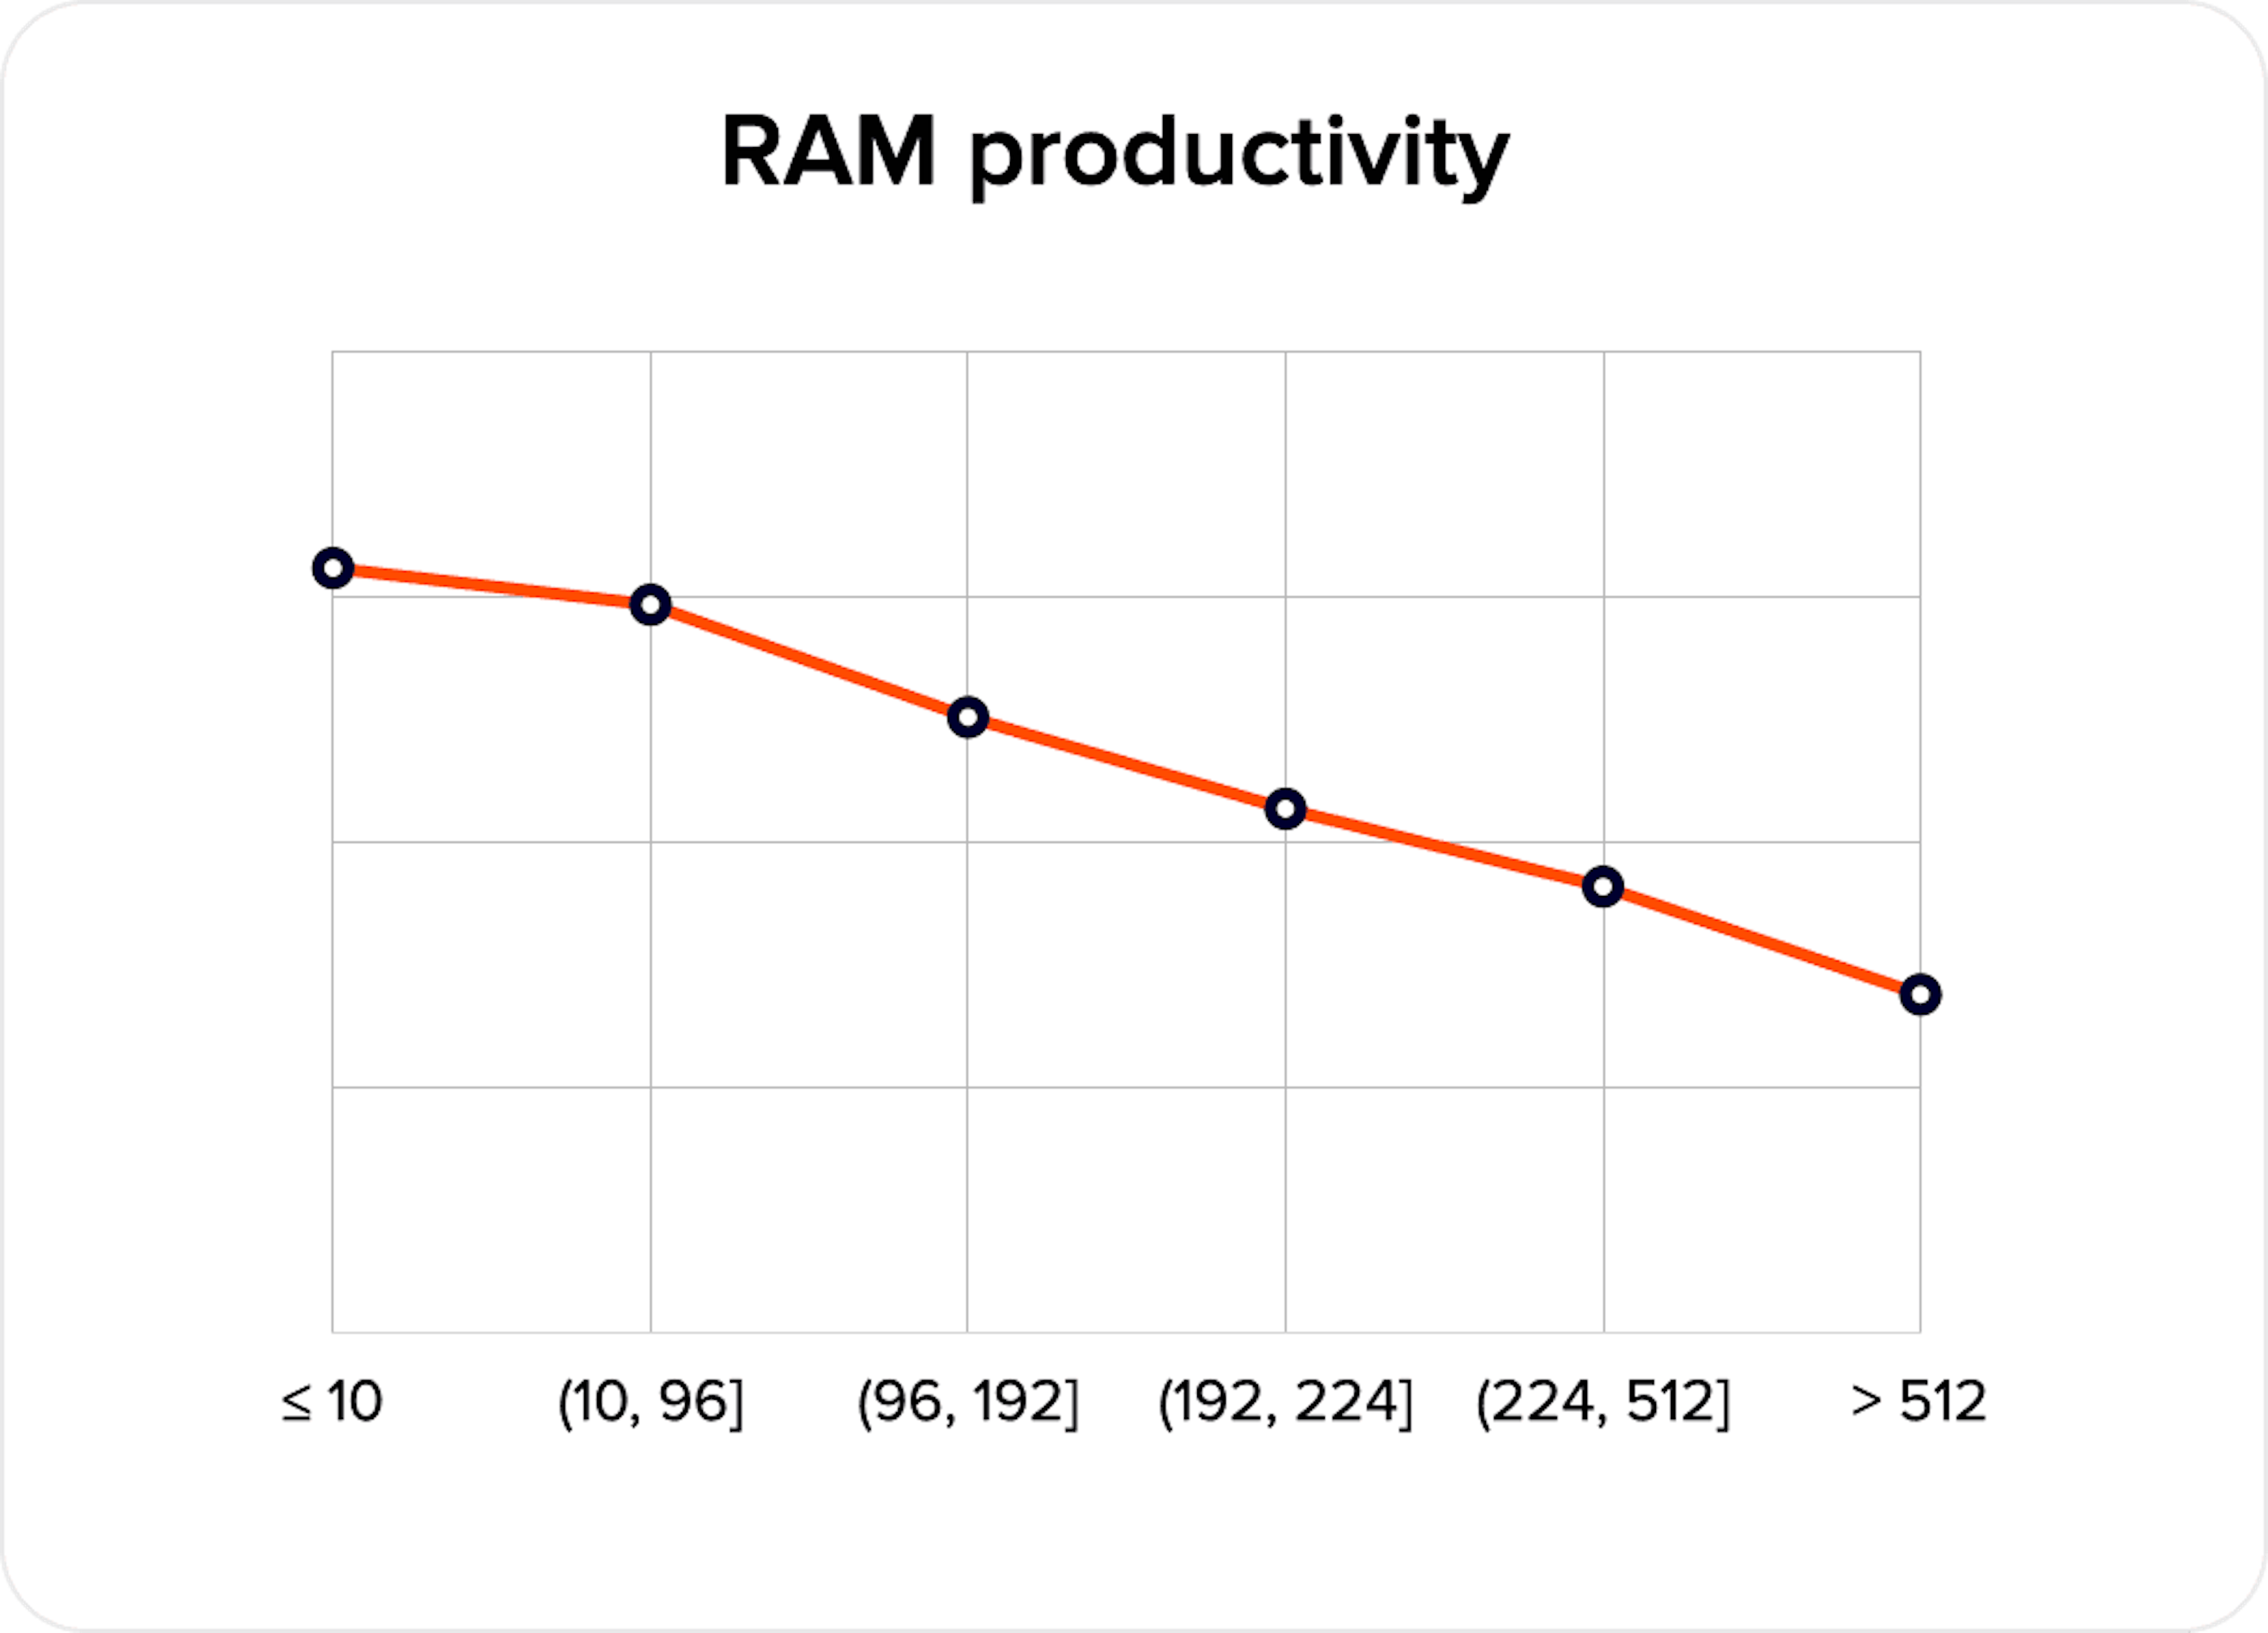
Lower values may indicate a segment with lower disposable income, while higher values are more commonly associated with more stable segments.
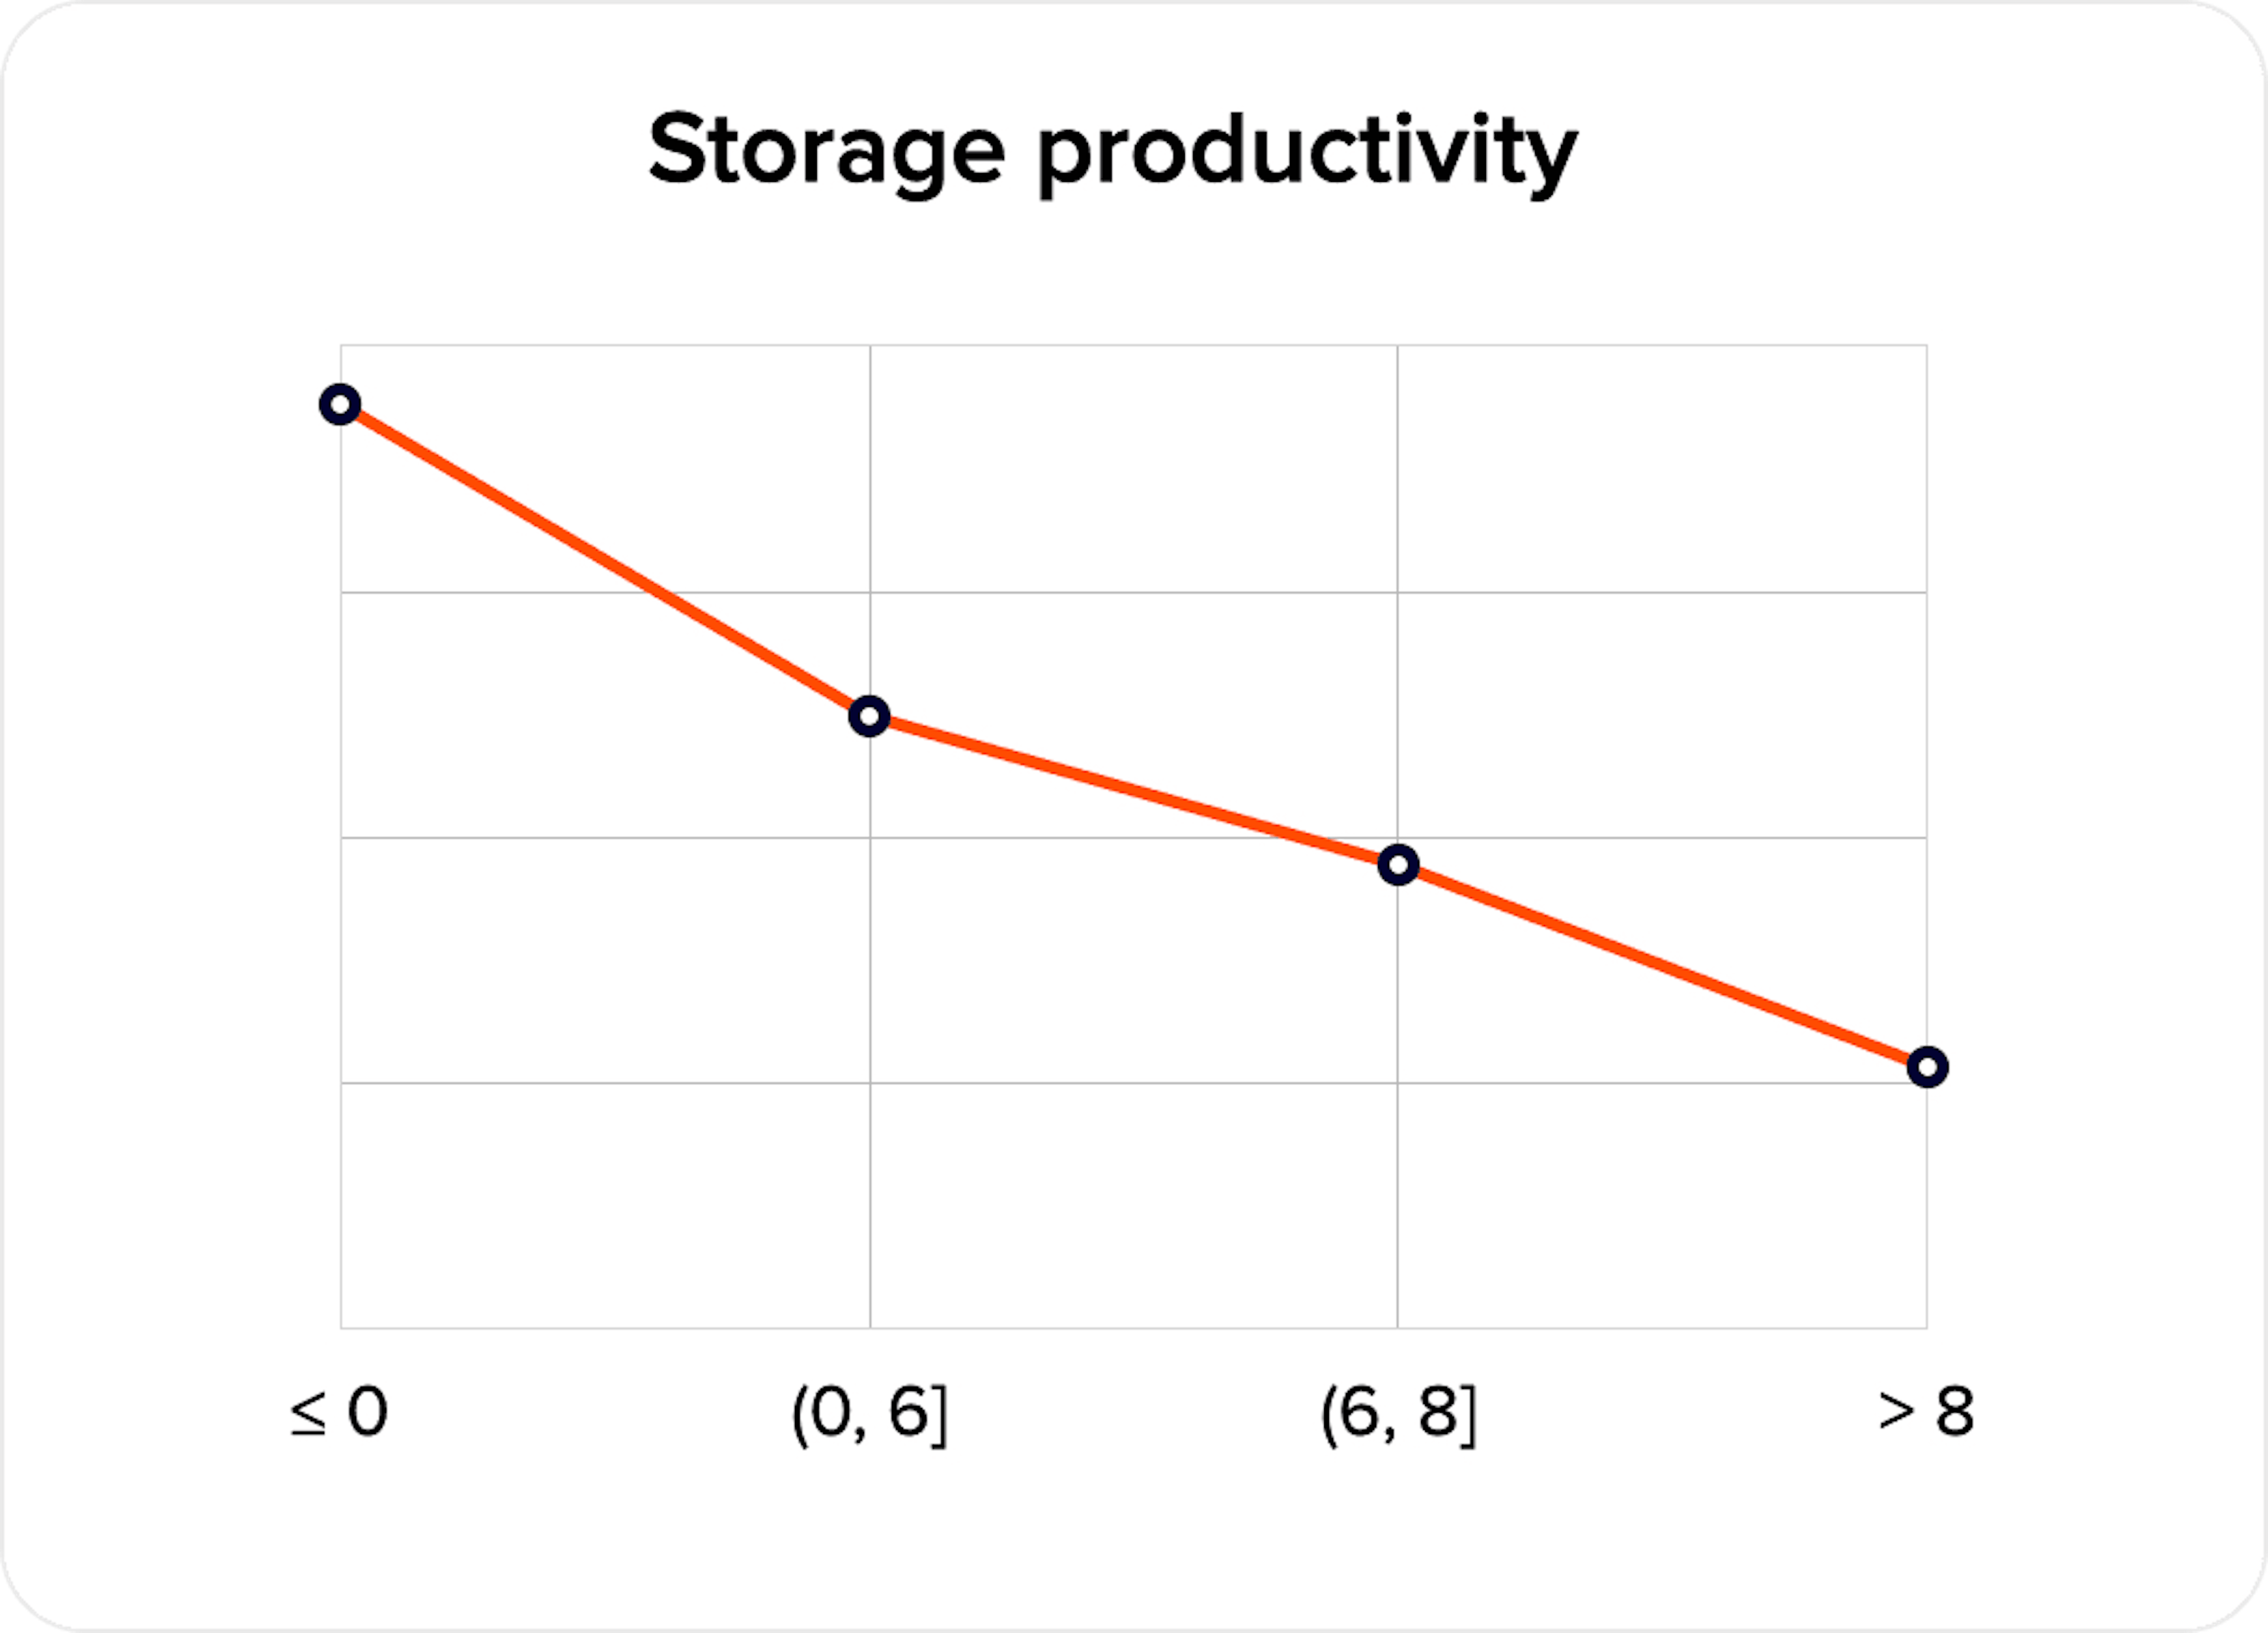
At the same time, anomalous RAM or storage values can signal elevated risk of technical manipulation, such as virtualization or randomization. In such cases, the issue is not a technically weak device, but an environment in which the device no longer represents a genuine user. For scoring models, this distinction is critical.
A key element in this group is IDX10 Expected Income Estimation, a numerical index correlated with a virtual user’s disposable income. It is applicable to both web and mobile SDKs.
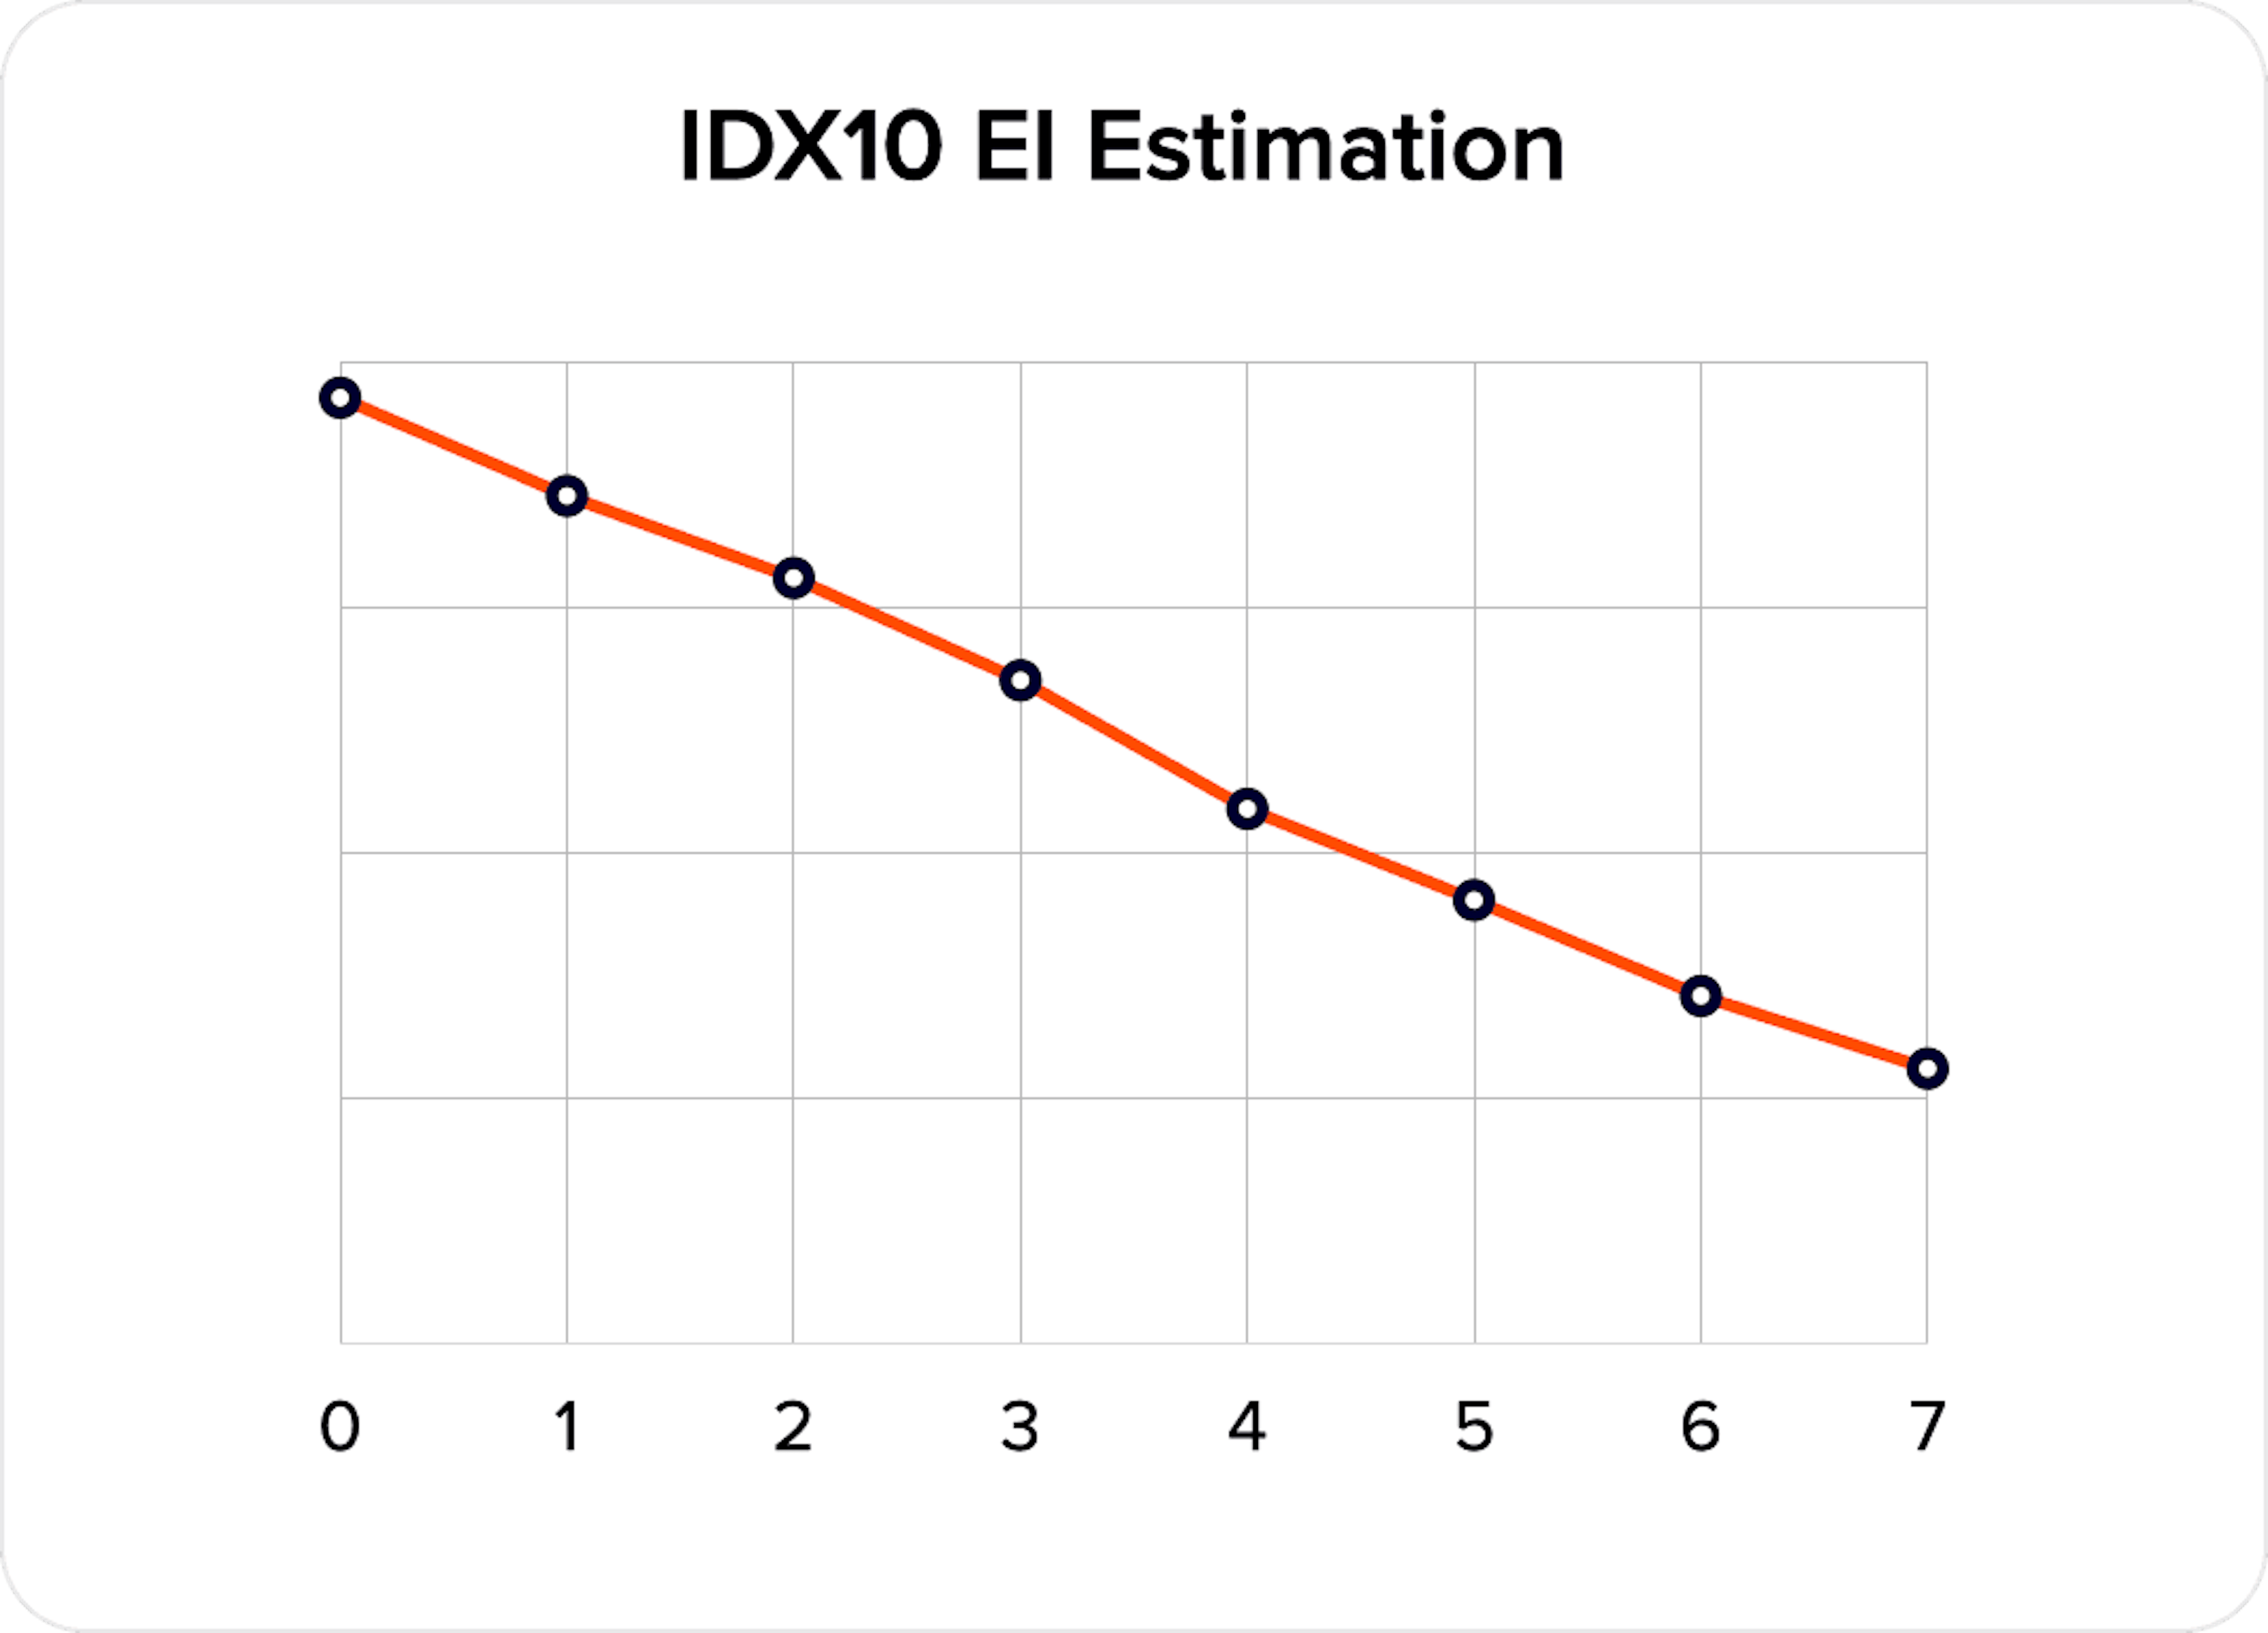
This class of signals is fundamentally important. Disposable income remains one of the strongest drivers of credit decisions, yet direct data collection often fails because these questions create discomfort for end users. Applicants may avoid them, provide approximate figures, or submit unreliable responses. An index that estimates income indirectly addresses this challenge more elegantly – without added friction or pressure on the customer. This parameter is strongly recommended for both operational and credit risk assessment.
In practice, the greatest impact comes from combining signals. Network parameters provide infrastructure context, device performance helps segment users and detect anomalies, and behavioral markers add interaction dynamics. Quality and income indices connect these layers and improve decision accuracy.
The result is a more precise scoring mechanism that helps retain strong customers while preserving portfolio quality.
We continue to develop an approach centered on analyzing a user’s digital environment and real-time behavior, strengthening this logic at the product level. With API18, we are expanding and retraining a set of behavioral and environmental markers that help scoring models make more accurate decisions – without collecting sensitive information or requesting additional user data.
Our product roadmap is grounded in applied research into the relationship between online behavior and financial risk. One example is our analysis of digital behavioral patterns and their correlation with payment discipline and user stability. In API18, these research insights are translated from the analytical layer into practical signals that can be directly applied within real-world scoring models.

JuicyScore API 17 introduces 17 new variables, improved indexes, and a faster infrastructure to enhance fraud prevention, risk analysis, and client experience.

Modern technologies are becoming more robust, and security measures more sophisticated. But there’s one vulnerability that can’t be patched — human trust.

Modern web applications use dynamic interfaces based on the DOM (Document Object Model).
Get a live session with our specialist who will show how your business can detect fraud attempts in real time.
Learn how unique device fingerprints help you link returning users and separate real customers from fraudsters.
Get insights into the main fraud tactics targeting your market — and see how to block them.
Phone:+971 50 371 9151
Email:sales@juicyscore.ai
Our dedicated experts will reach out to you promptly